How did iFood manage to identify duplicate tables in the Data Lake?
iFood stands out as a data-driven organization, where product developments and strategic decision-making are grounded in data. To sustain this standard of excellence, it is essential to provide engineers, analysts and scientists with the necessary autonomy to create and manage their own solutions, thus promoting a culture of innovation and analytical self-management.
With this freedom, interesting challenges arise such as dealing with the production and management of redundant data. Without effective monitoring of Data Lake (DL) tables, this problem can result in unnecessary processing and storage costs, in addition to increasing the complexity of the data landscape.
In an attempt to identify and mitigate these inefficiencies, we sought some possibilities in the literature and ended up adopting and adapting the algorithm proposed by Raunak Shah et al. in the article “R2D2: Reducing Redundancy and Duplication in Data Lakes“. The work brings an innovative and mainly inexpensive approach, from a computational standpoint, which builds and refines relational graphs between datasets to identify tables with potentially redundant data, highlighting opportunities for gains and simplification of the corporate data environment.
What was the starting point?
The original algorithm is composed of a chain of three stages capable of delivering, as a final product, a map of relationships between pairs of tables whose data are potentially duplicated. At each stage applied, its result serves as input for the next, which refines and delivers a set of table pairs that is more accurate than that obtained by the previous stage. In summary, the stages are:
➢ “Schema Graph Builder (SGB)” Stage — This component basically compares schemas between columnar tables and determines which are those that are coincident or that have some containment relationship. For example, if a table A has all the columns of table B, this may indicate that A potentially contains all the data from B, making B a source of duplicated information (therefore, without need for existence). And these relationships are represented in graph form.
The SGB uses an intelligent clustering approach to avoid costly O(N²) comparisons between all tables. The algorithm works as follows:
1. Sorting: Tables are sorted by schema cardinality (number of columns) in descending order;
2. Cluster formation: The sorted list is traversed and, for each schema:
- If it is not contained in any existing cluster → it becomes a new cluster center;
- If it is contained in some cluster → it is added as a member of this cluster;
3. Graph construction: Within each cluster, directed edges are created between pairs of tables where real containment exists, always pointing from the larger table to the smaller one.
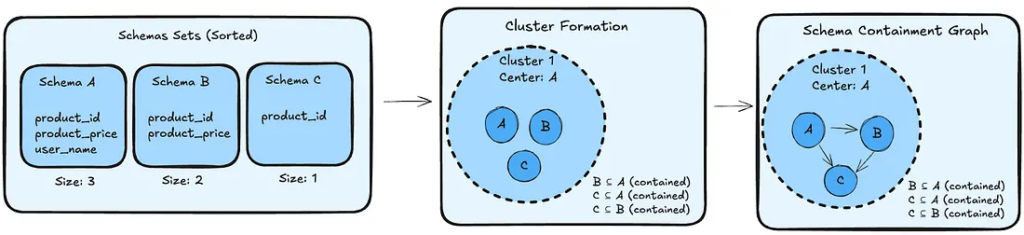
This strategy ensures that no containment relationship is lost, while maintaining computational complexity at O(N log N) + O(K(N-K)), where K is the number of clusters formed — much more efficient than the approach of comparing all tables with each other.
➢ “Min-Max Pruning (MMP)” Stage — After graph creation, some connections are removed (filtering) based on minimum and maximum values between common numerical columns. The principle applied is that, if a dataset A is contained in B, for all common numerical columns, then:
1. The minimum value in column A must be greater than or equal to the minimum value in column B.
2. The maximum value in column A must be less than or equal to the maximum value in column B.
If any of these conditions is violated, the MMP algorithm removes the connection between the datasets in the graph, indicating that containment is not possible.
➢ “Content Level Pruning (CLP)” Stage — In this phase, the algorithm adjusts relationships in graphs (new filtering) by examining the table data itself, at a granular row level.
The CLP uses sampling techniques to decide whether connections (or potential containment relationships between datasets) should be maintained or excluded. If set A is fully contained in B, this containment relationship should be valid even for sampled subsets of A. By querying specific subsets of A, and verifying their presence in B, the algorithm ensures precise containment inference without needing to scan entire tables.
Limitations
This SGB ⇒ MMP ⇒ CLP approach demonstrated satisfactory results in the case studies conducted in the article. However, considering iFood’s specific context and the reality of a company that deals daily with Data & AI at large scale, we identified some necessary adaptations to better serve the operational scenario and the characteristics of our DL. Important: without abandoning the original premise of composing an efficient and low-cost solution.
The main challenges that motivated these adaptations include:
- Infrastructure limitations for statistical metadata: The implementation of the MMP stage, when working with tables in purely Parquet format, is trivial and inexpensive because the files natively possess minimum and maximum data values. This is not the case with Delta tables we work with at iFood. This would require a robust statistical metadata architecture, including: (1) automated pipelines for determining min/max in all numerical columns; (2) storage and versioning of these metadata; and (3) handling edge cases like null values and varied data types. This infrastructure, although technically viable, would represent a significant investment and violate the solution’s premise.
- Processing overhead: The comparison between table contents, as proposed by the CLP stage, without prior calculation of min/max values would demand excessive computational resources, impacting performance and also violating the premise.
- Duplication inherent to Medallion Architecture: By nature, medallion architecture can result in table duplication. This scenario is expected when data is ingested in the bronze layer, processed in silver and subsequently made available in the gold layer for consumption. In the absence of significant transformations between layers, data duplication becomes a reality.
How did we do it?
We reformulated the original algorithm and replaced the MMP and CLP stages with two new stages with the same objective of filtering and incremental refinement of results, but bringing iFood’s technology reality into play and giving our signature to the solution.
We sought to preserve and/or increase the precision and relevance of results while maximally eliminating false positives. The image below illustrates the constructed algorithm, in an approach we named SGB ⇒ DLP ⇒ LTP.
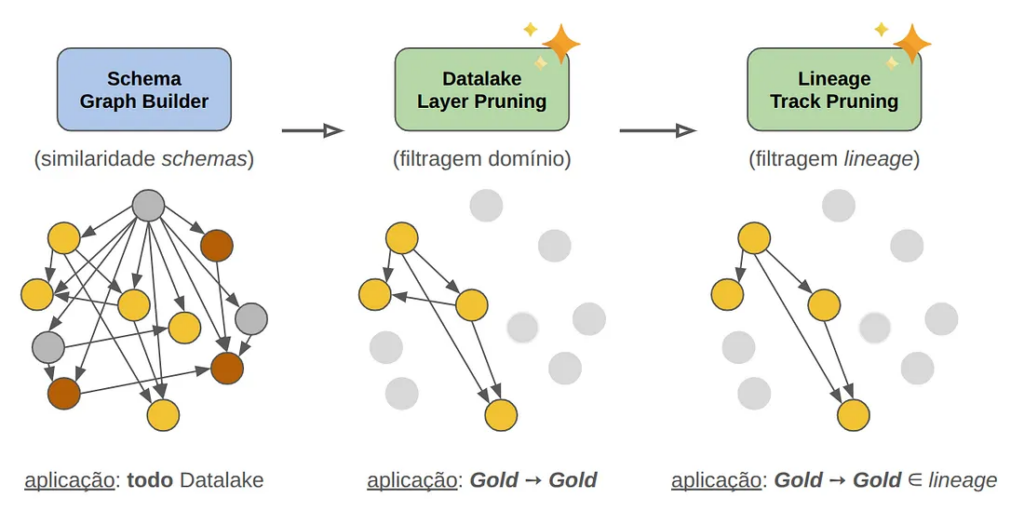
➢ “Schema Graph Builder (SGB)” Stage
We kept this component unchanged as it offers the fundamental guarantee of 100% detection of containment relationships between schemas. The SGB continues to be our solid foundation for identifying all possible hierarchical relationships between tables based on their columnar designs.
➢ “Data Lake Layer Pruning (DLP)” Stage ✨ NEW ✨
We introduced a context-based filtering that allows directing the algorithm to specific areas of the Data Lake, reserving the potential and accuracy of redundant information identification to known niches and naturally discarding redundancies inherent to internal processes:
- Domain Filtering: We restrict application and analysis to specific business domains (e.g.: Groceries, Fintech areas, etc.).
- Layer Filtering: We focus on specific layers of medallion architecture (e.g.: bronze, silver, gold).
Main Benefits:
- Significant reduction in scope and volume of data under analysis, eliminating irrelevant comparisons between tables from completely uncorrelated contexts.
- Direct activation of data and business teams for validation of the proposed solution and also for more effective addressing when eliminating/removing identified duplicate data.
➢ “Lineage Track Pruning (LTP)” Stage ✨ NEW ✨
We leveraged a powerful resource present in our DL known as Data Lineage and implemented lineage validation to eliminate false positives resulting from coincidences between schemas:
How it works:
- We reconstructed the complete lineage of each table (direct and indirect upstreams and downstreams), thus determining the entire history of data and its dependencies.
- We maintained only containment relationships between tables that have a real connection in the data pipeline (i.e., belong to the same storyline).
Observed Impact:
- Elimination of false positives: We discovered that many tables had similar schemas by pure coincidence, without any real relationship between their data, sometimes resulting from systemic standardizations (for example: tables with API monitoring data always adopt the same columns, despite referring to different systems).
- Greater precision: We focused only on containment relationships that make sense from the data flow perspective.
Tests and Validations under Controlled Domain
With the algorithm prototype in hand, it was time to put it to the test. Instead of going directly to a large-scale implementation, we adopted a more strategic and directional approach: we selected a specific Business Domain to serve as our validation laboratory. And the Fintech team agreed to the partnership!
Our goal went beyond simply measuring the algorithm’s accuracy rate. We wanted to understand how domain experts perceived our solution and what insights they could offer to improve it.
The Surprising Result
The numbers spoke for themselves: of 76 pairs of tables identified as having a potential duplication relationship, 60 of them truly reflected completely redundant information between them!!! This represents approximately 79% algorithm accuracy. For a first test, this result exceeded some of the most optimistic expectations.
Of these 60 pairs, a total of 30 tables could be identified as duplicates and, after their detailed audit, domain experts were already able to take concrete cleanup actions. The remaining identified pairs also involved tables whose schemas, lineages and contexts were correlated, but constituted sub-samplings of data from each other, sometimes built for optimization reasons of reading processes for large datasets. Despite not being purely duplicated datasets, this opened opportunities to revisit and question their real necessity.
Technical Curiosity: from building the primary graph of duplication relationships (SGB stage) to filtering based on lineage membership (LTP stage), the algorithm scans the entire Data Lake. This involves more than 15 thousand tables with volumes of several hundred Terabytes!!! Despite this, due to the skillful nature of its construction, this process takes around 10 minutes on a modest infrastructure (a few small-sized Spark workers instances).
The Momentum for the Next Phase
This first result had a transformative effect on the project’s perception. The confidence generated by the numbers opened the way for two important expansions to make it a robust and scalable solution for the company:
- Horizontal Scalability: extend the application to all iFood domains.
- Structural Automation: automate the entire pipeline, from detection of redundant information to visibility and activation of responsible parties.
Automation and Robustness
Our automation solution was structured in three main phases, each with well-defined responsibilities:
Phase #1: Detection and Analysis
The heart of the system resides in the main algorithm that sequentially executes the three essential stages:
- Schema Graph Builder (SGB): builds the containment graph identifying hierarchical relationships.
- Data Lake Layer Pruning (DLP): filters by context (domain & layer) to reduce noise.
- Lineage Track Pruning (LTP): uses lineage to increase accuracy and eliminate false positives based on belonging to the same storyline.
This process is orchestrated via Airflow, which ensures periodic, resilient and reliable pipeline execution. The result of each execution is persisted in the Data Lake, creating a traceable history of all potential duplication detections.
Phase #2: Intelligent Communication
A second component, also orchestrated via Airflow, consumes the redundancy analysis results and translates technical insights into effective action suggestions.
Using a personalized bot alongside the main communicator adopted by the company, the system directly notifies owners and those responsible for tables identified as potentially redundant, guiding them with metadata and facilitating how to identify, access and evaluate them.
Phase #3: Autonomy in Decision Making
Instead of simply informing about the problem, we offer notified responsible parties clear action options in a direct channel for activation via communicator (such as, for example, immediate removal of tables, inclusion of them in exception lists — when duplication is intentional or necessary, suggestion of alignment between teams for optimization/convergence/reduction of essential datasets, etc.).
Improvement Opportunities
Despite positive results, we continuously remain focused on making the solution even more efficient and intelligent. We have already identified specific areas for future algorithm improvement, among them:
Schema Flexibility
The algorithm currently requires exact correspondence of nomenclature between columns, which may leave out some cases of duplication relationships as a consequence of typos, pattern discontinuity in the data lifecycle post-transformation, etc. In productive pipelines, it’s common to find tables from the same lineage with identical columns that were renamed for adaptation to specific processes (e.g.: customer_id vs. client_id). These tables, despite being semantically equivalent, are not detected by the current SGB stage.
Ambiguity in Symmetric Relations
When two tables have exactly the same columns, the algorithm creates a bidirectional relationship (A ⊆ B and B ⊆ A, simultaneously). This situation, although technically correct, can generate confusion in interpreting results, requiring more detailed analysis of which table should be removed or maintained. This aspect awakens our intention to adopt DataViz solutions that better fulfill this role and illustrate relationships in graphs more intelligibly.
Semantic Validation by LLM
After some PoCs (Proof of Concept), we identified the potential of including a new additional semantic validation layer after the lineage filter. This stage incorporates into the solution, beyond the schemas, other extra metadata sources and especially the source codes of ETLs behind the involved tables. From this perspective, we have:
- Analysis of notebooks and codes that compose ETLs using the textual analysis power offered by Large Language Models (LLMs).
- Validation if pipeline transformations truly indicate similarity of purpose.
- Detection of cases where tables have similar and/or equivalent schemas, but distinct purposes.
Such improvements elevate the algorithm to the level of a solution that combines structural analysis with semantic understanding, significantly increasing its precision at a cost that preserves its premise of delivering an innovative and inexpensive path for maintaining a healthy Data Lake.
Conclusion
Our adaptation of the R2D2 algorithm demonstrated that it is possible to generate real value by adapting academic research to the corporate context. With 79% accuracy in a first pilot application detecting potential redundant tables, we evolved from a controlled and very manual experiment to a complete automated solution, with application in the entire iFood Data context. This solution delivers today the potential to keep our Data Lake healthier, more efficient and reduced of unnecessary redundant information.
We replaced complex and higher-cost components existing in the original solution with lighter and smarter equivalents, based on filtering directed to business context and incorporating powerful Data Lineage resource. This approach safely reduced false positives and aligned with our technological reality with minimal effort.
The identified improvement opportunities — schema flexibility, symmetric relationship handling and semantic validation by LLM — point to an even more precise and intelligent next iteration.
References
R2D2: Reducing Redundancy and Duplication in Data Lakes [2023]; Raunak Shah et al.; Proceedings of the ACM on Management of Data, Volume 1, Issue 4 (DOI: https://doi.org/10.1145/3626762 — alternative: arXiv:2312.13427)
Text written in partnership with
Rafael Mattos, data & AI engineer at iFood.

Build the future at iFood
We are always looking for passionate developers, designers and data scientists to help us revolutionize the food delivery experience. Join iFood Tech and be part of building the future of food technology.
Discover our CareersYou might also like to read
Read more about Dados & IA
How iFood’s generative AI connects personalization and communication through rigorous engineering patterns to scale unique user experiences
How iFood's generative AI connects personalization and communication through rigorous engineering patterns to scale unique user experiences From Grouped Campaigns to Individual Decisions [4:30 PM, Tuesday] Haven't had lunch yet, right? The Mushroom Risotto you love is waiting for you…

Yggdrasil: Scaling Authorization at iFood with Cedar and a Stateless Architecture
In a microservices ecosystem as dynamic and complex as iFood's, ensuring that people and systems have appropriate access to the right resources is a constant challenge. Historically, in most cases, authorization logic is implemented in a decentralized and inconsistent manner…


How iFood Enhanced Feature Management to Combat Fraud
In this publication, we present how iFood benefited from using a Features Platform, which in addition to simplifying feature management, also provided a robust, efficient infrastructure and mitigated latency problems previously faced in fraud detection and combat. The digital revolution…

Meet other Authors
Each article is the result of the vision and expertise of our authors. See who contributes to our blog: